State By State: A February Update On Australia’s Property Markets
March 02 2020Overview:
-
Sydney house prices increased by 1.5% over the last month with recovery concentrated across the premium end of the housing market.
-
Melbourne house prices increased by 1.4% over the last month with the expensive property prices increasing considerably more than affordable homes.
-
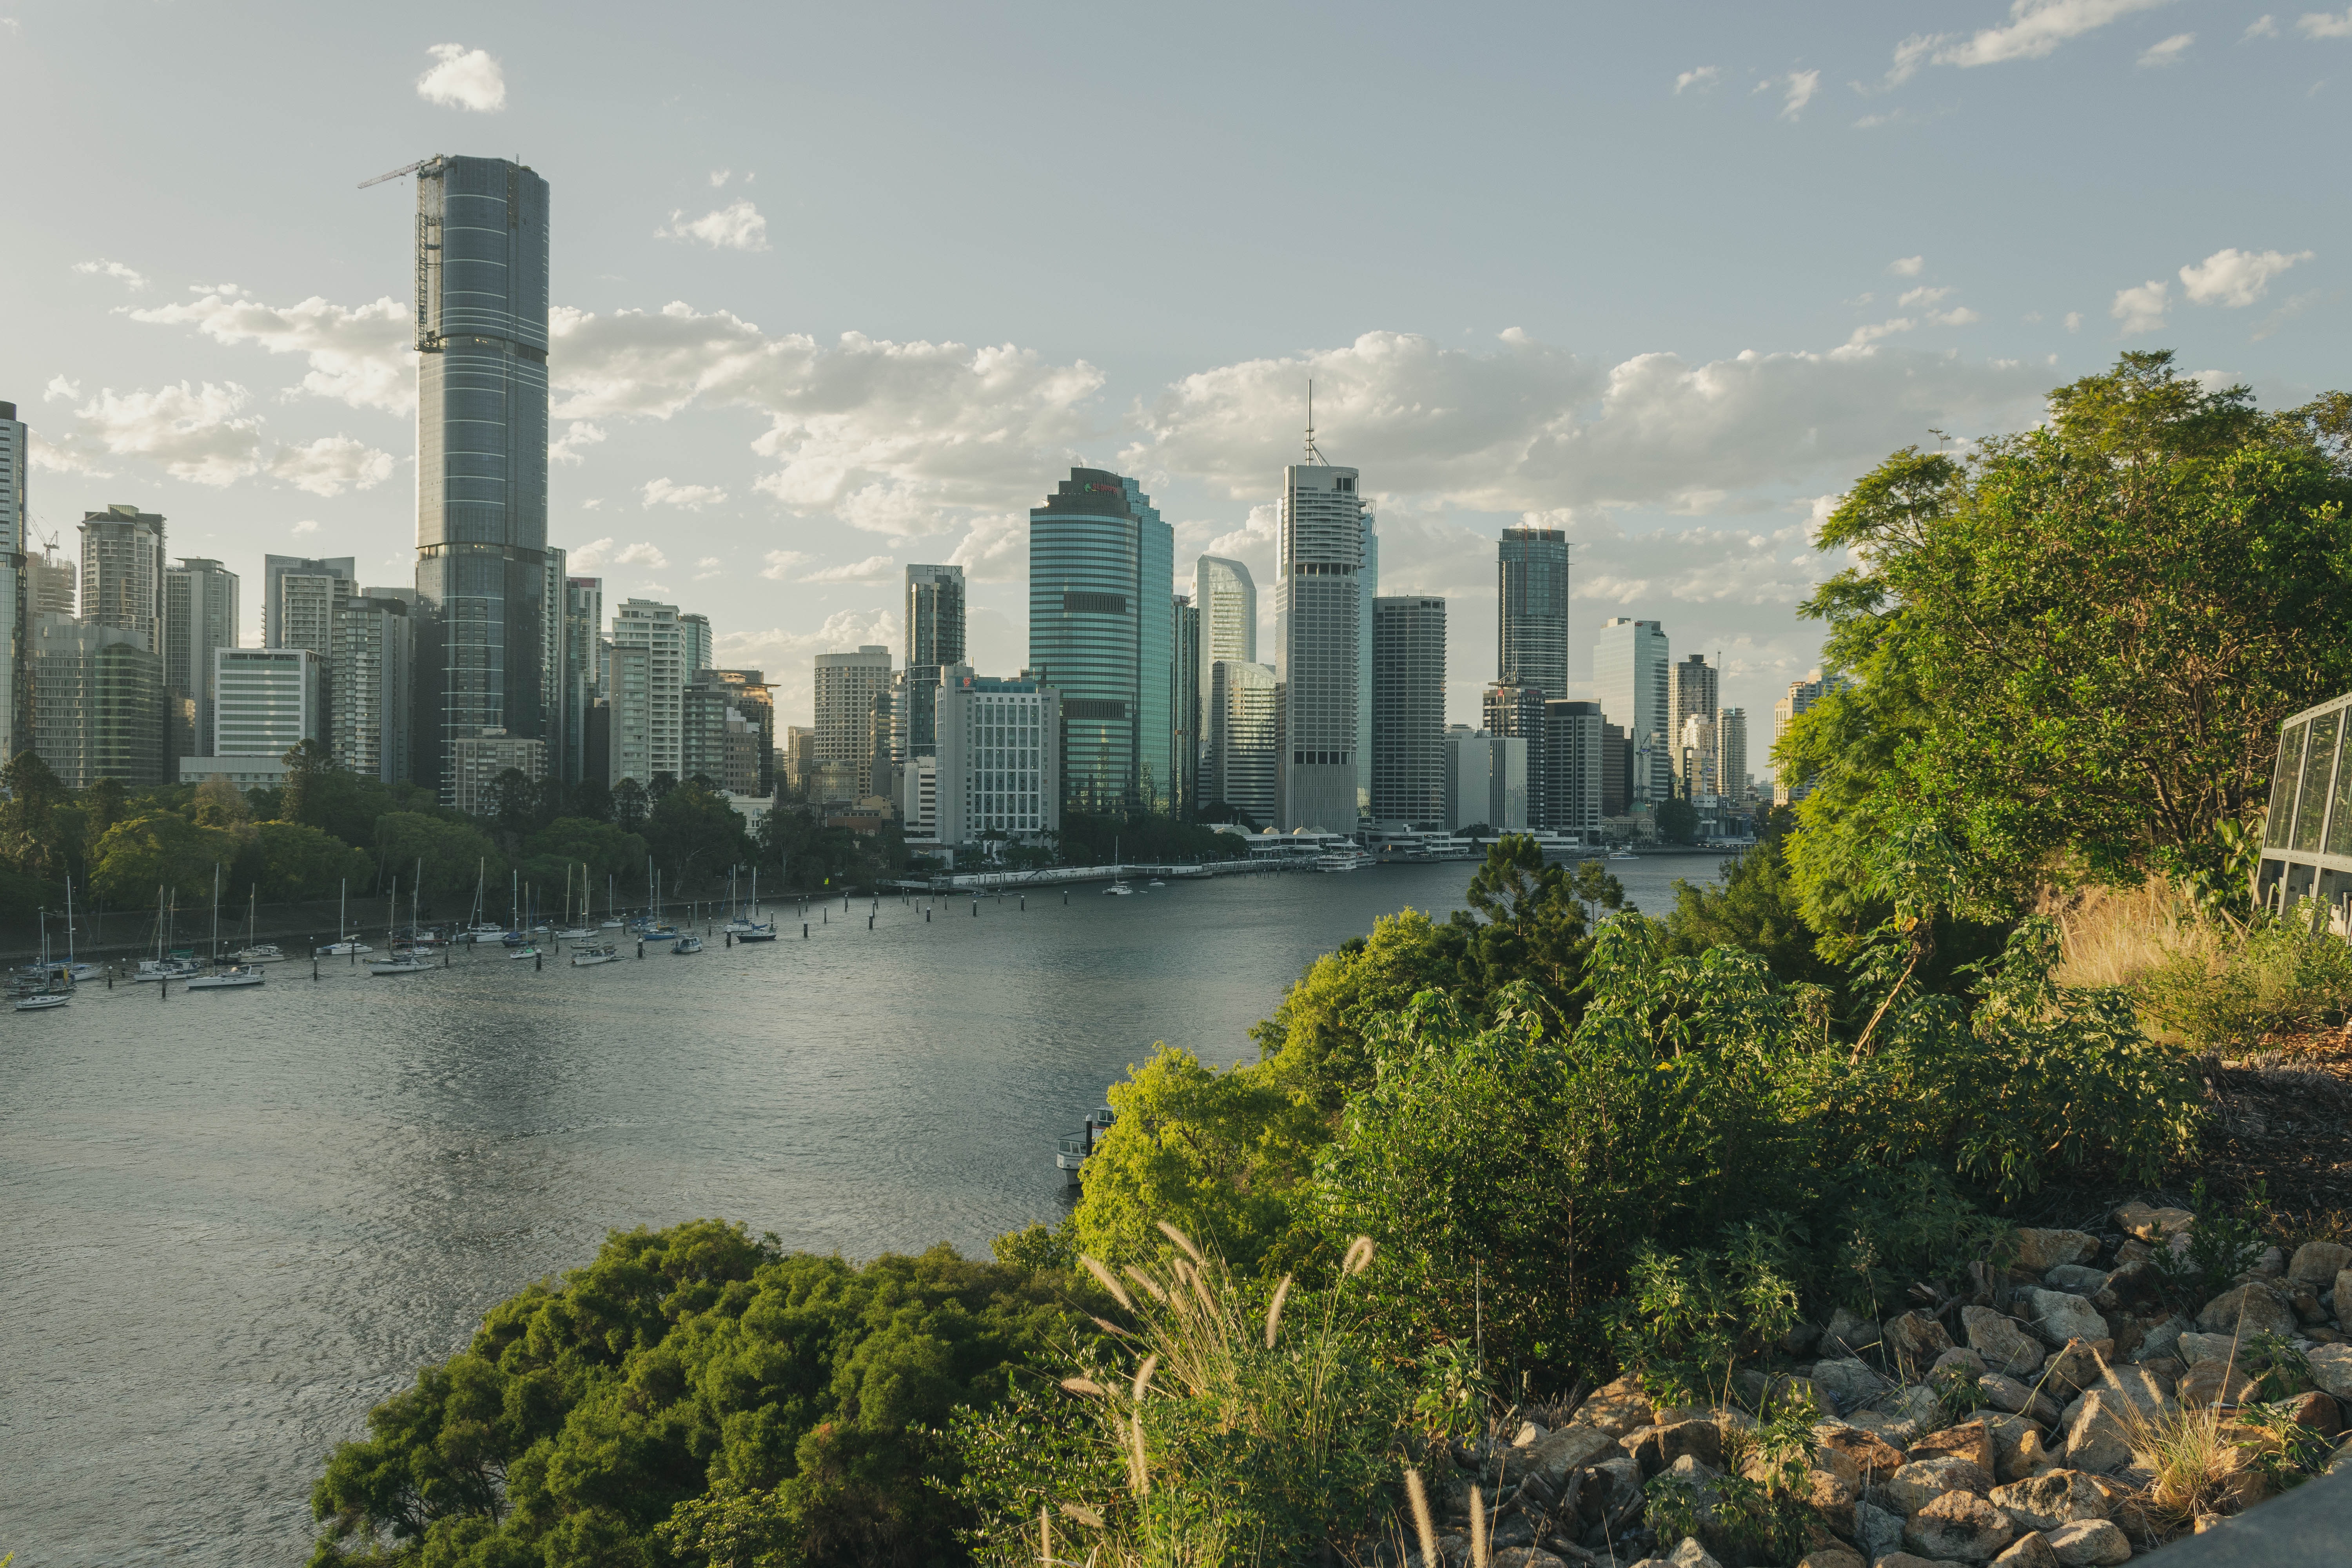
Brisbane house prices increased by 0.7% over the last month while remaining relatively more affordable than the former two cities.
Australia’s housing markets rebounded strongly last year, and this strength has continued into 2020.
In fact, the property upturn which started in our big two capital cities in the middle of last year has become more widespread, with housing values rising across every capital city in January according to the latest stats from Corelogic.
While Sydney and Melbourne continue as the leaders for property value increases, the speed of growth has lost some momentum over recent months.
Sydney
The Sydney property market is on the move having recorded its quickest turnaround in decades.
Since bottoming out after the election in May, Sydney dwelling values have recovered by 11.2%.
Sydney house prices increased 1.5% over the last month (6.7% over the last quarter), while apartment values increased by 0.3% over the last month (3.2% over the last quarter).
The recovery is most concentrated across the premium end of the housing market where values were previously falling more rapidly.
The top quartile of the market is up 6.9% over the past three months and 10% higher over the year, while values across the lower quartile were 3.2% higher over the quarter and are only 3.4% higher over the past year.
The following metrics confirm the increased strength of the Sydney housing market:
- The average selling time of a home is 33 days (57 days a year ago);
- Vendors are discounting their properties an average of 3.5% to affect a sale (7.3% a year ago); and
- 17% more properties sold in Sydney in the last 12 months compared to the previous year.
Currently investors and homebuyers are abandoning the off-the-plan apartment sector for many reasons, including concerns about construction standards. Many of those who purchased off-the-plan a few years ago are now having trouble settling with valuations coming in on completion at well below contract price at a time when banks are more reluctant to lend on these properties.
In the background, strong economic growth and jobs creation is leading to population growth and ongoing demand for property in Sydney.
At the same time international interest from migrants continues.
The beginning of this new cycle is a great time to look at buying an investment-grade property in Sydney, which is currently offering investors an opportunity to buy established apartments in the eastern suburbs, lower North Shore and inner west at a slight discount to what they would have paid a number of years ago.
Melbourne
Melbourne property prices are surging with dwelling values up 8.2% higher over the last year taking them to only 1.2% below their October 2017 peak.
House values are rising faster than unit values across Melbourne, up 1.4% over the last month (5.6% over the last quarter) while apartments rose in value by 0.7% (3.5% over the last quarter).
At the current rate of growth, we are likely to see Melbourne home values reach a new record high over the next month or so.
But the Melbourne property market is very fragmented, with values of more expensive properties rising considerably more than affordable houses.
The following metrics confirm the increased strength of the Melbourne housing market:
- The average selling time of a home is 31 days (45 days a year ago);
- Vendors are discounting their properties an average of 3.5% to affect a sale (6.7% a year ago); and
- 7.9% more properties sold in Melbourne in the last 12 months compared to the previous year.
The Melbourne property market is moving from strength to strength, after exhibiting the strongest rebound in modern history.
Buyers are back, sellers are back, and auction clearance rates are high despite rising volumes of properties for sale.
Overall property values will be underpinned by a robust economy, jobs growth Australia’s strongest population growth and the influx of 35% of all overseas migrants.
Remember, Melbourne rates as one of the 10 fastest-growing large cities in the developed world, with its population likely to increase by around 10% in the next four years.
Brisbane
Brisbane’s property downturn was quite shallow compared to the big two capital cities and following its recent upturn property values have reached a new peak.
Brisbane house prices increased by 0.7% over the last month (2.3% over the last quarter) while apartments in Brisbane dropped in value by 0.6% over the last month (+0.4% over the last quarter).
However, Brisbane property prices are still about 55% of Sydney’s while household incomes are only about 12% lower, making Brisbane a very affordable alternative for home buyers and investors.
A recent report by valuers m3property showed there is still a significant oversupply of new Brisbane apartments, with about one in four new apartments in the Brisbane CBD remaining unsold.
The following metrics show how the Brisbane housing market is improving:
- The average selling time of a home is 50 days (49 days a year ago);
- Vendors are discounting their properties an average of 4.0% to affect a sale (4.9% a year ago); and
- 6.5% fewer properties sold in Brisbane in the last 12 months compared to the previous year.
With migration rates lifting, supply under control and generally healthy levels of housing affordability, the Brisbane housing market fundamentals are looking healthier compared to most other capital cities.
At the same time the underlying strong demand from home buyers and investors from the southern states at a time when yields are attractive and housing affordability is relatively healthy and putting a floor under property prices.
Brisbane’s economy is being underpinned by major projects such as Queen’s Wharf, HS Wharf, TradeCoast, Cross River Rail, the second airport runway and the Adani Coal Mine, but jobs growth from these won’t really kick-off for a few more years.
Overall, the Australian housing markets are striding along
Vendor metrics have generally improved over recent months with the number of days to sell a property decreasing (a sign of the tight supply situation), vendor discounting decreasing (it’s easier for them to sell), and auction clearance rates starting the year on a very strong note.
Other market indicators
The trend in population growth has eased as both the rate of net overseas migration and the rate of natural increase fell.
Net overseas migration is forecast to average a net inflow of 243,000 people per annum in the next three years and most of these people have jobs and are at household formation age.
But new dwelling approvals are trending lower and expected to fall further as presales become tougher which means that we’re likely to have an undersupply of properties in 2021.
Latest ABS data reveals that total value of home lending seasonally adjusted increased by 4.9% over December compared to the previous month — the third consecutive monthly increase.
All sectors reported rises in lending over December with owner-occupiers (excluding first home buyers) up 5.3%, first-home buyers up 6.2% and investors up by 2.8% over the month.
Compared to 2018 however, lending totals for 2019 remained lower, with overall owner-occupiers down 5.2% and investors still down 19.2% — for a total annual lending decline of 9.2%.
Lending for first-home buyers, however, bucked the trend, increasing by 4.6% over 2019 compared to the previous year.
Source: https://www.smartcompany.com.au/industries/property/february-housing-markets-update/
Yardney, M. (2020, February 21). State by state: A February update on Australia’s property markets. Retrieved from https://www.smartcompany.com.au/industries/property/february-housing-markets-update/