August 26 2019
What percentage of Aussie households own a home? Which state has the highest housing costs? How many households own multiple properties? We reveal the answers to these questions and more…
The latest housing occupancy figures from the Australian Bureau of Statistics (ABS) – based on data from its Survey of Income and Housing conducted from July 2017 to June 2018 – have provided us with a number of insights into the state of our relationship with property in this diverse landscape.
Home ownership
The average Australian’s long-held proclivity for home ownership appears to be waning, although perhaps not by choice.
Around two-thirds (66%) of Australian households owned their home in 2017-18 – either with or without a mortgage.
This is down from 68% in 2015-16 and 70% a decade ago in 1997-98.
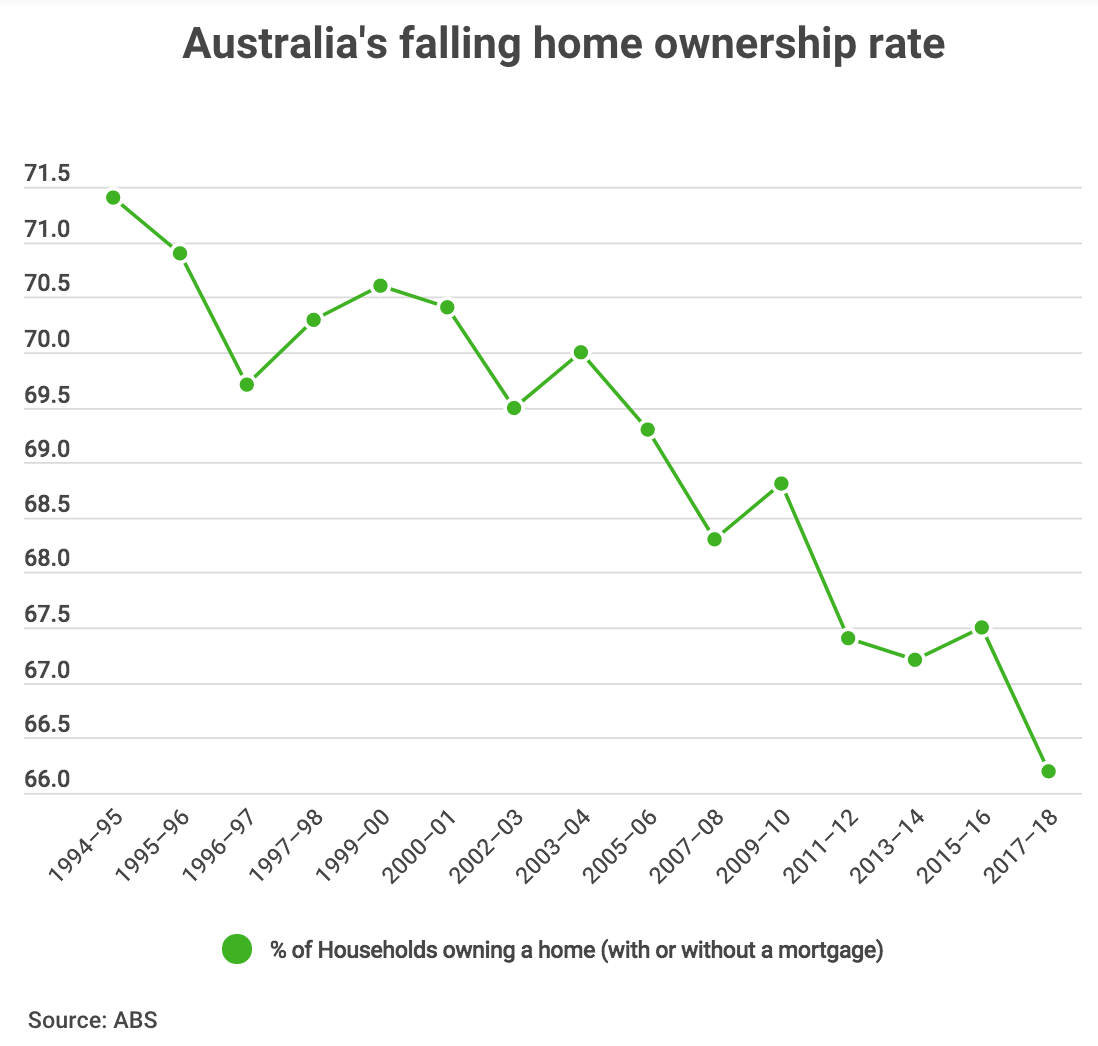
It’s actually Australia’s lowest rate of home ownership since the survey began in 1994, but it’s pretty much on par with the rates in countries with similar cultures, such as the United States, the United Kingdom, Canada and New Zealand.
However, it’s significantly higher than in Germany and Switzerland, where rates of home ownership typically hover around 40-50%.
Outright home ownership
But far fewer Australians own a home outright (i.e. without debt) these days compared to a decade ago. There’s actually more homeowners with a mortgage now than those without:
- 30% of households own a home without a mortgage (down from 40% in 1997-98)
- 37% of households own a home with a mortgage (up from 31% in 1997-98)
Renting in Australia
Meanwhile, renters (either renting from a private landlord or a state housing authority) now make up 32% of Australian households – up from 30% in 2015-16 and 27% in 1997-98.
Most of these renters rent via a private landlord as opposed to from a state or territory housing authority:
- 27% of households rent from a private landlord (up from 20% in 1997-98)
- 3% of households rent via a state or territory housing authority (down from 6% in 1997-98)
Home ownership by state
Across the states and territories, the home ownership rate is highest in Tasmania (72%) and lowest in the Northern Territory (59%), which may have something to do with the average housing costs in those respective regions (see housing costs section).
- New South Wales home ownership: 64% home owners, 34% renters
- Victoria home ownership: 68% home owners, 29% renters
- Queensland home ownership: 63% home owners, 36% renters
- Western Australia home ownership: 70% home owners, 28% renters
- South Australia home ownership: 69% home owners, 30% renters
- Tasmania home ownership: 72% home owners, 26% renters
- Northern Territory home ownership: 59% home owners, 39% renters
- Australian Capital Territory home ownership: 64% home owners, 34% renters
Home ownership by age
The majority of Australians appear to spend much of their twenties circling the renting roundabout, with renters significantly outnumbering home owners in both the 15 to 24 and 25 to 34 age brackets.
But the tables suddenly turn in the 35 to 44 age bracket with more people settled into home ownership – swapping roommates for spouses, house parties for house decor, bongs for babies…you get the picture.
Proportion of home owners and renters by age of household reference person:
- 15 to 24: 10% home owners, 86% renters
- 25 to 34: 37% home owners, 61% renters
- 35 to 44: 62% home owners, 37% renters
- 45 to 54: 72% home owners, 27% renters
- 55 to 64: 78% home owners, 21% renters
- 65 to 74: 83% home owners, 15% renters
- 75 and over: 84% home owners, 14% renters
Australian housing costs
Unless you’ve inherited a 10-bedroom manor and spend your days dusting your Fabergé egg collection, you’ll be well aware that Australian housing comes at a cost.
Such costs include rent, mortgage repayments and rate payments.
According to the ABS, these were the average weekly housing costs across the different Australian households in 2017-18:
- Home owners with a mortgage: $484 (up 40% from 1997-98, adjusted for inflation)
- Home owners without a mortgage: $53 (up 51% from 1997-98, adjusted for inflation)
- Renters (private landlord): $399 (up 51% from 1997-98, adjusted for inflation)
- Renters (housing authority): $158 (up 52% from 1997-98, adjusted for inflation)
Across all Australian households, the average weekly housing costs were $311.
Between the different states and territories, the average weekly housing costs were highest in the Northern Territory ($394) and lowest in Tasmania ($207):
- New South Wales average housing cost: $334
- Victoria average housing cost: $307
- Queensland average housing cost: $302
- Western Australia average housing cost: $327
- South Australia average housing cost: $239
- Tasmania average housing cost: $207
- Northern Territory average housing cost: $394
- Australian Capital Territory average housing cost: $337
Housing affordability
The ‘affordability’ of housing in Australia is measured by the ABS as the ratio of housing costs to gross household income.
By this simplistic measure, the 2017-18 stats show that housing affordability has actually been pretty stable over the past decade, even improving for households with a mortgage.
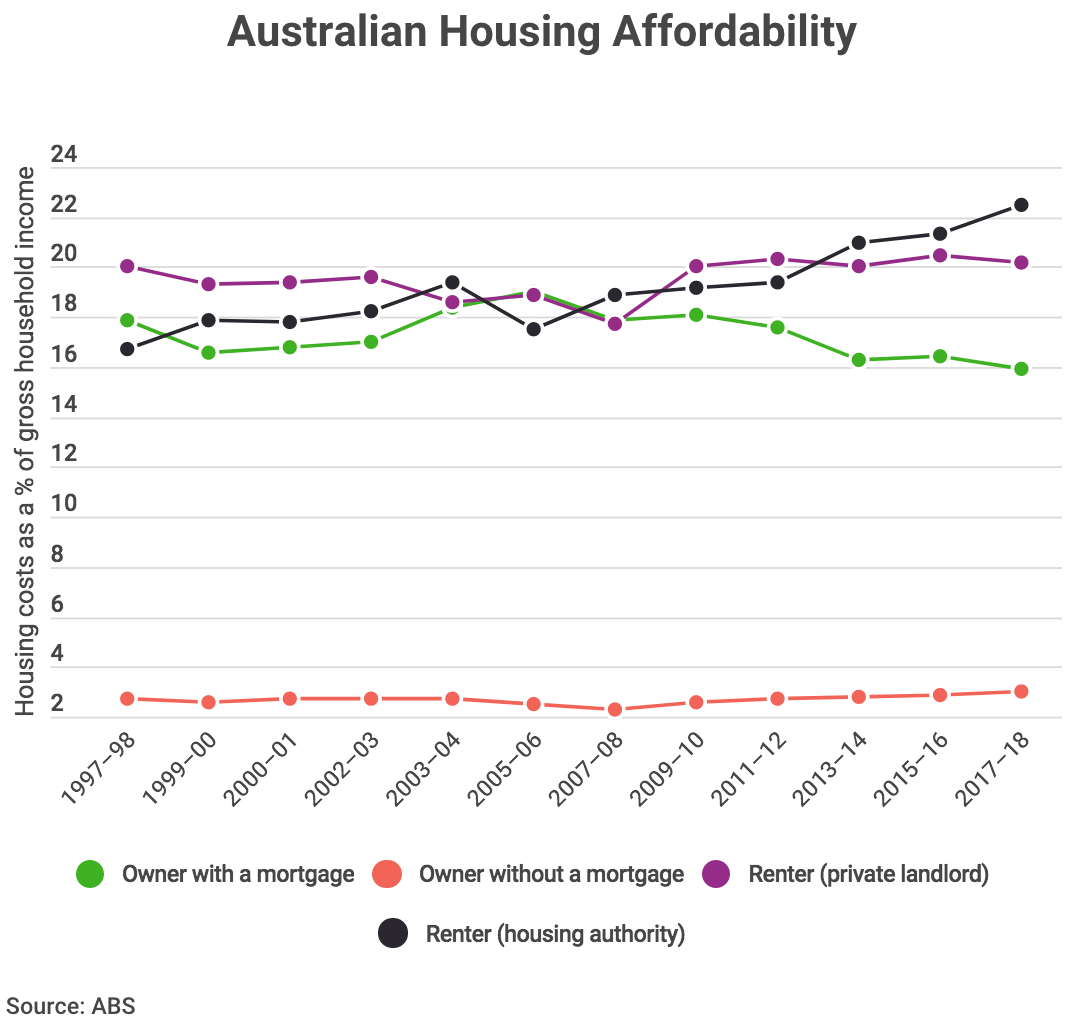
Housing costs as % of gross household income, 2017-18:
- Home owners with a mortgage: 15.9% (down from 17.9% in 1997-98)
- Home owners without a mortgage: 3.0% (up from 2.7% in 1997-98)
- Renters (private landlord): 20.2% (up from 20.0% in 1997-98)
- Renters (housing authority): 22.5% (up from 17.9% in 1997-98)
This flies in the face of the recent media moral panic over Australia’s housing affordability “crisis”.
However, it’s worth noting that the official cash rate was 5.00% back in 1997-98 compared to 1.50% in 2017-18.
This largely explains how the housing costs of home owners with a mortgage could now take up a smaller percentage of household income compared to a decade ago – despite average capital city house prices roughly quadrupling over that period.
Owning housing for non-residential purposes
According to the 2017-18 stats, one in five Australian households – that’s 1.86 million – own property besides the one they’re residing in.
This includes those that own investment properties and/or holiday homes.
Of those:
- 71% (1.3 million) owned one property (besides their current place of residence)
- 18% (343,100) owned two properties
- 5.8% (108,000) owned three properties
- 4.6% (86,000) owned four or more properties
First home buyers in Australia
Let’s not forget about those taking their first step into property ownership.
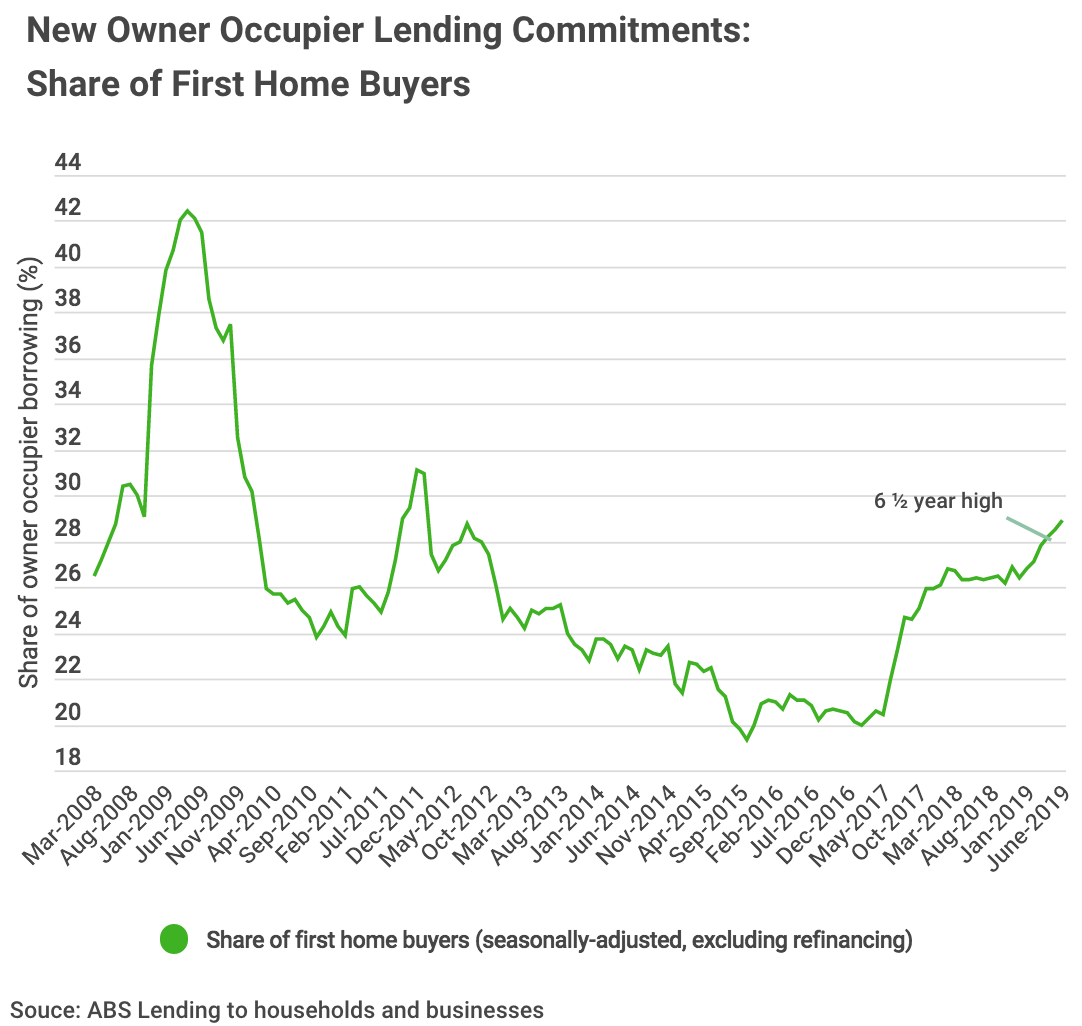
According to the June ABS household lending data, first home buyers accounted for just under 29% of all owner-occupier borrowing commitments.
This is actually the highest it’s been in over six years – likely a result of the recent widespread falls in property prices which have helped put homes within reach for many aspiring homeowners.
Of the 349,000 first home buyers surveyed for the ABS in 2017-18:
- 94% owned their home with a mortgage.
- 55% were in a household with a reference person aged under 35 years.
- 69% were either couple families with dependent children (38%) or couple only families (31%).
- 23% of the dwellings they recently bought were new
That last point is particularly interesting, given most first home buyer grants are restricted to those buying or building new properties.
It suggests that around three-quarters of first home buyers are forgoing grants worth between $7,000 to $26,000 because they’d prefer to buy an established home.
This could be because of the higher cost of new property – the median value of “new” property purchased by first home buyers was $603,000 while “established” property was only $470,000.
As for the types of property purchased by first home buyers:
- 77.9% purchased a separate house
- 13.0% purchased a semi-detached, row or terrace house, townhouse
- 9.4% purchased a flat or apartment
Source: https://www.savings.com.au/home-loans/by-the-numbers-australian-home-ownership-tenancy-statistics/
Beattie, D. (2019, August 20). Housing Statistics in Australia: Home Ownership & Rent. Retrieved from https://www.savings.com.au/home-loans/by-the-numbers-australian-home-ownership-tenancy-statistics/